🔎 The Zoom Feature, how to see the evolution of an indicator throughout the session
In the app, you have the possibility to see the impact which your trainings have to the movement and cardio of your horse.
Click on the indicator of your choice in the session report (rhythm, impulsion, symmetry, heart rate, speed...).
A first graph appears, representing the evolution of your chosen indicator during the session. A bar with different colors appears at the bottom: it represents the gait over time. This way, you can find your way around the whole session.
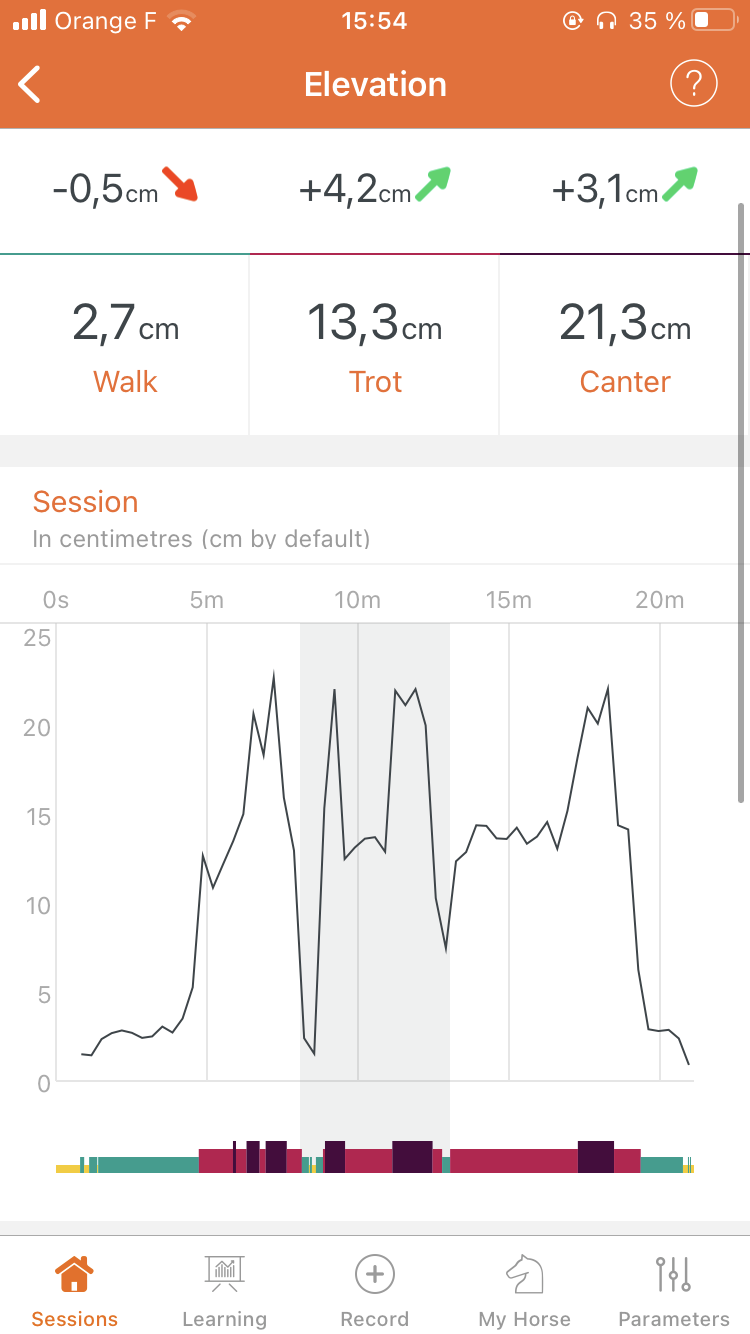
- yellow = halt
- green = walk
- pink = trot
- purple = canter
- the small circles represent the jumps when there are some.
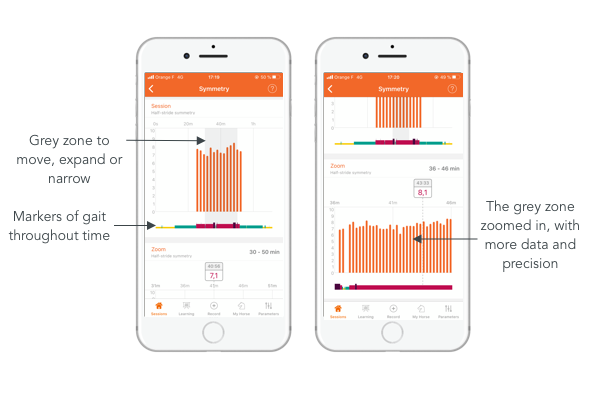
The Zoom 🔎
In order to allow you to go into even more detail in the analysis, you can zoom in on a part of the session, to better see the evolution over a particular period, even a very short one.
To do so, you just have to move the grey bar on the first graph and eventually tighten or enlarge it by pinching with 2 fingers according to the level of detail you wish to have.
The zoomed area appears on the graph just below.