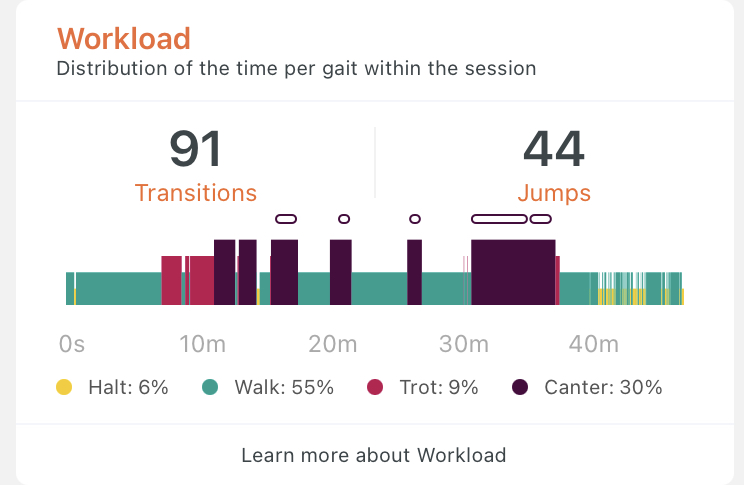
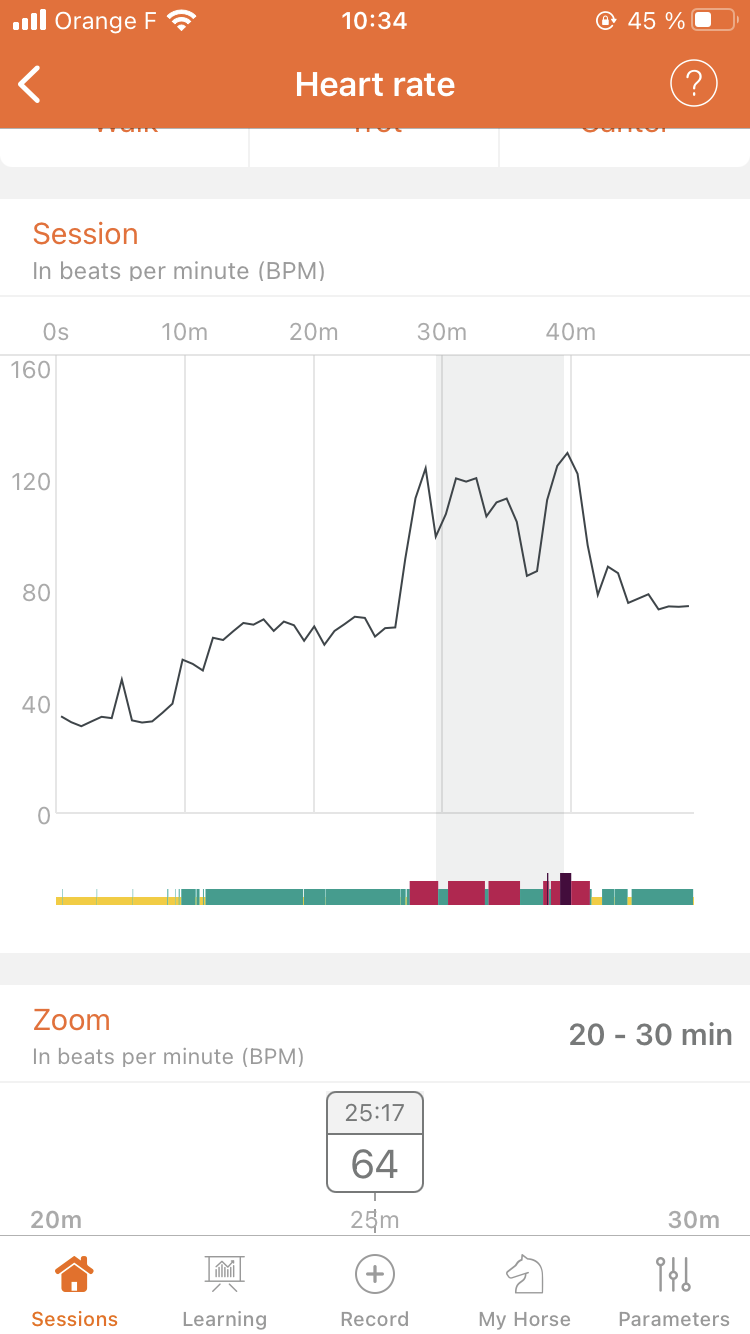
The time spent at each gait
Definition
The time spent at each gait allows you to know the total time spent at halt, at walk, at trot and at canter.
The distribution of the gait allows you to review how the session was constructed. It allows you to appreciate the distribution of work between warm-up, return to calm and work.
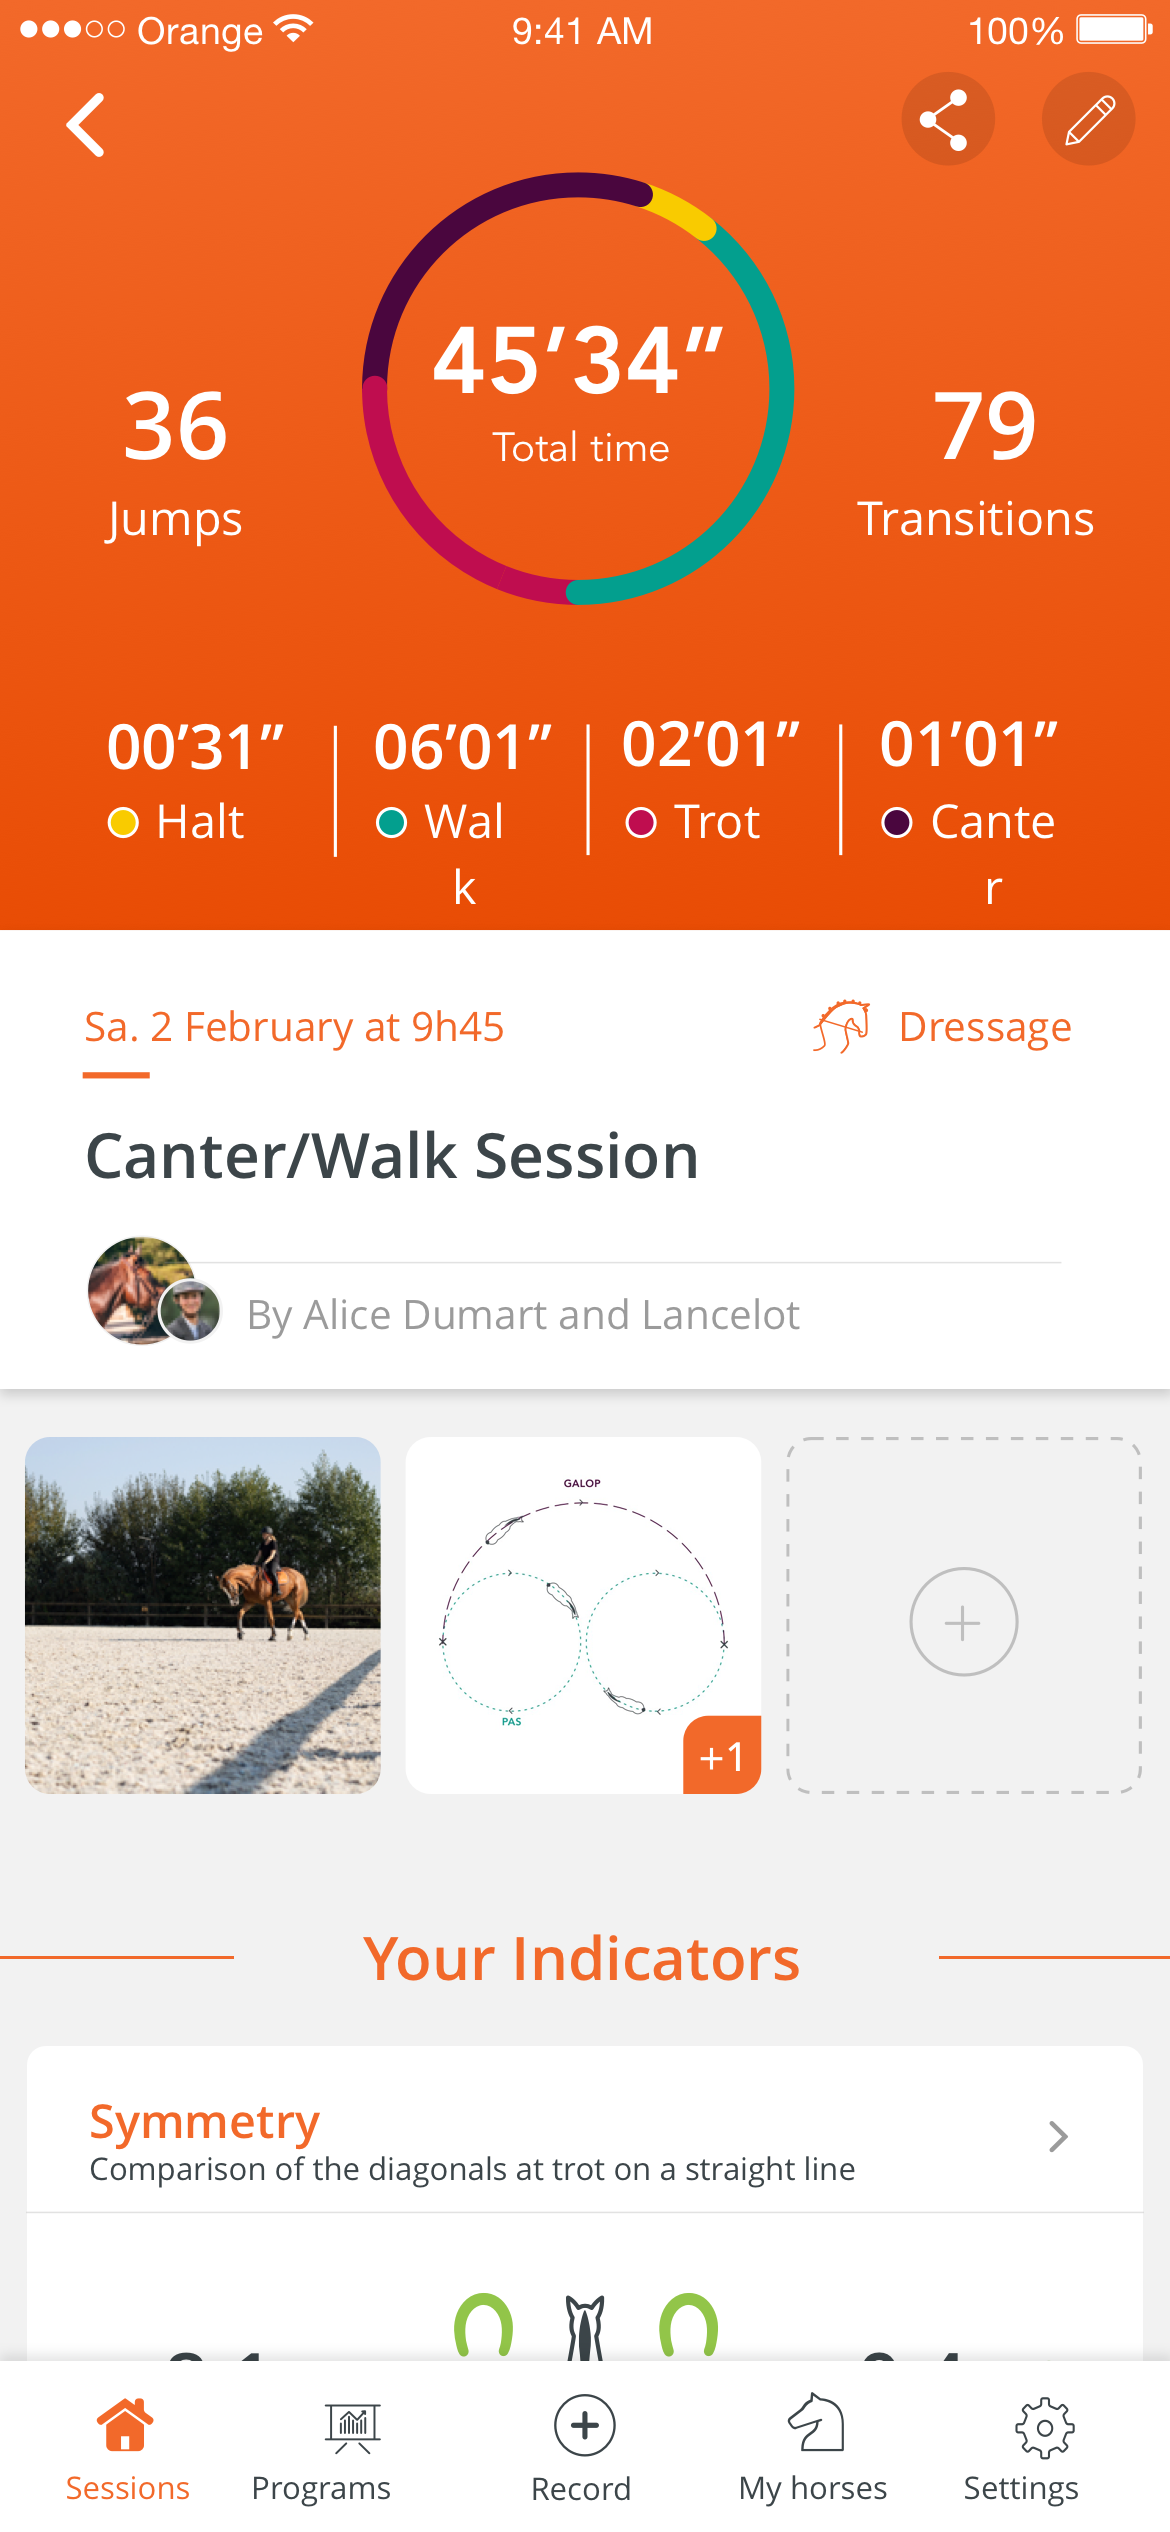
Throughout the application, the same color code of the gaits is used:
- yellow for halt
- green for walk
- raspberry pink for trot
- purple for canter
This graph showing the distribution of gaits over time will accompany all the other indicator graphs to help you find your way through the session:
Just like here for the heart-rate:
Does gait detection work on all horses?
Today, we can easily calculate it for horses and ponies of category C-D.
However, the algorithm as it is now does not work in some cases:
- Small ponies (less than 1m35)
- Horses with western gaits such as the very slow canter in which there is no support phase
- Tölt and other specific gaits
The time spent on each gait surprises me!
At the beginning of your experience with Equisense, the results may seem surprising. Most riders tend to overestimate the time spent at a canter, especially because it is easy to confuse it with the distance covered, which is necessarily greater than at another gait.
Tracking this indicator allows you to have an objective view of the progress of your session: which pace at which time, breaks respected, how long at each gait...